Greggle · Ways of thinking · Cause and Effect
A way of thinking · best for a ProblemCause and Effect
Go wide across the categories before you go deep, so that a whole class of cause is not simply forgotten.
Kaoru Ishikawa, 1960s
a Problem, a Risk
Forty minutes
Evidence, or the honesty to mark a guess as a guess
Where it came from
Kaoru Ishikawa was a professor of engineering at the University of Tokyo and one of the people who built Japan’s approach to quality after the war. He is usually credited with drawing the first cause-and-effect diagram for engineers at Kawasaki’s shipyards in the 1940s, and he set it out properly in his Guide to Quality Control in 1968, which reached English in 1976. The problem is the fish’s head. The ribs are categories of cause. Under each rib, the causes that belong to it.
In a factory the ribs were traditionally the six Ms: manpower, methods, machines, materials, measurement and mother nature, meaning the environment. Ishikawa’s insight was less about the picture than about the discipline of working every rib in turn. Left to themselves, people put every cause under the one heading they already suspected, and the diagram made that visible.
Greggle uses six categories that are the same idea in plainer words: people, process, technology, materials and inputs, environment, and measurement.
Why it works
Where 5 Whys goes deep on one chain, this goes wide first. The categories force you to consider kinds of cause you would never have thought of on your own, and seeing them all on one page shows which ribs are crowded and which are empty. An empty category is a finding, if you actually looked. A forgotten one is not.
The second half of the discipline is marking each cause as verified, suspected or ruled out, with the evidence beside it. A board of confident guesses is worse than a short board of checked ones, because the guesses harden into facts the third time somebody repeats them.
When to reach for it, and when not to
Reach for it when a problem feels wide rather than deep: when you can already think of four unrelated reasons, or when 5 Whys keeps producing a different chain each time you run it. It suits a Problem above all, and a Risk that has happened somewhere else and you want to know how it could happen here.
It is the wrong tool for a problem with one obvious chain of causes; go straight to 5 Whys. And it is only useful if it ends with one most likely cause and the test that would settle it. A fishbone that ends with twenty equally plausible causes has organised the problem without advancing it. Greggle suggests it on a Problem and on a Risk.
How to run it
With a pen, on one sheet of paper.
- Write the effect as something observable: what happened, when it was first seen, and how you know. Not how it felt.
- Draw six ribs and name them: people, process, technology, materials and inputs, environment, measurement. Adapt the names if yours are obviously different, but keep six.
- Work every rib in turn, and list the causes that could sit under it, one per line, each stated as something that happens or fails to happen. Force at least one weak cause into the ribs you would have skipped.
- Beside each cause, write what makes you think so: a log, a message, a thing you saw, a person who saw it. Then mark it verified, suspected or ruled out.
- For every cause marked suspected, write the one thing you would look at to check it.
- Name the single cause you would bet on, say why in terms of the evidence rather than the conviction, and write the one test that would show you were wrong.
There is a one-page card with these steps and a blank grid to fill in, made to print on A4. Or the PDF.
On a Greggle board
Pick Cause and Effect on a Problem board and Greggle proposes the effect, six category steps each holding one cause to start, and the most likely cause at the end. Each category takes up to eight.
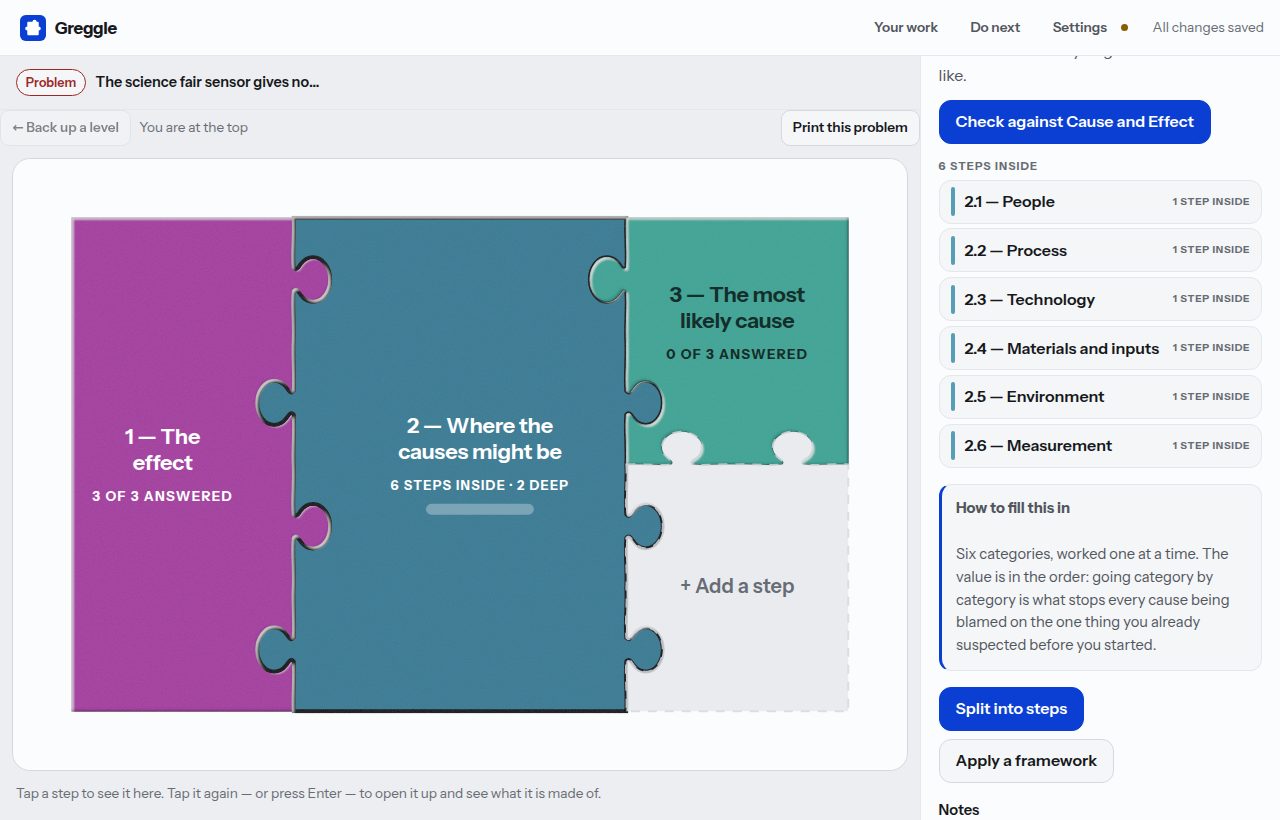
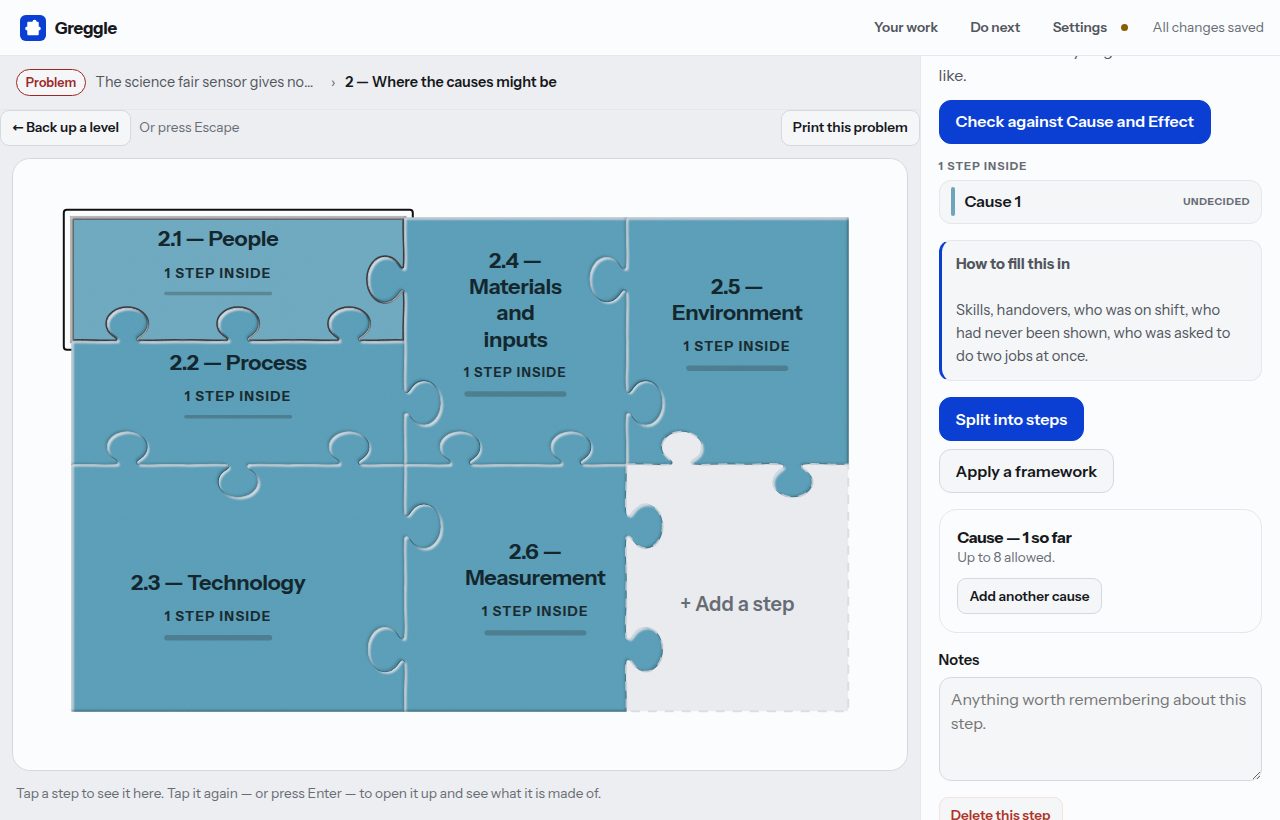
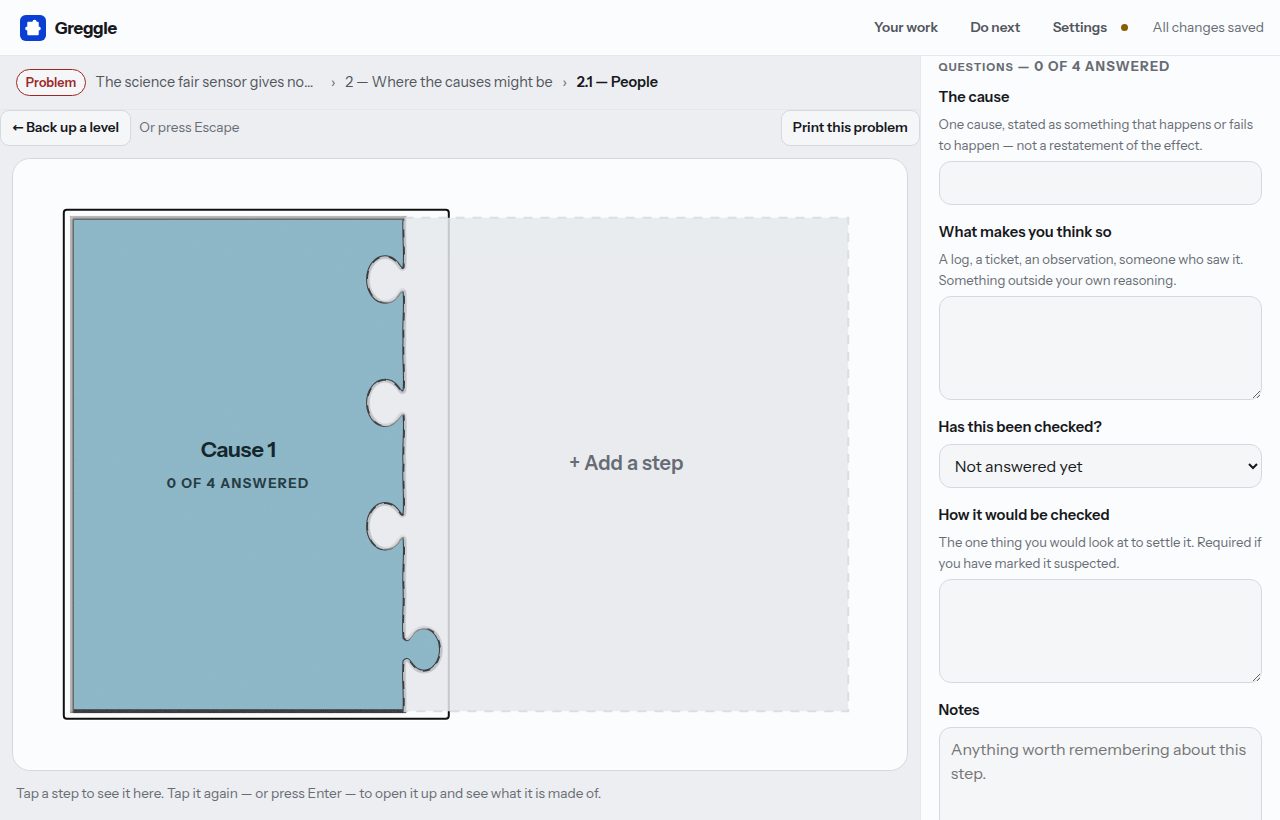
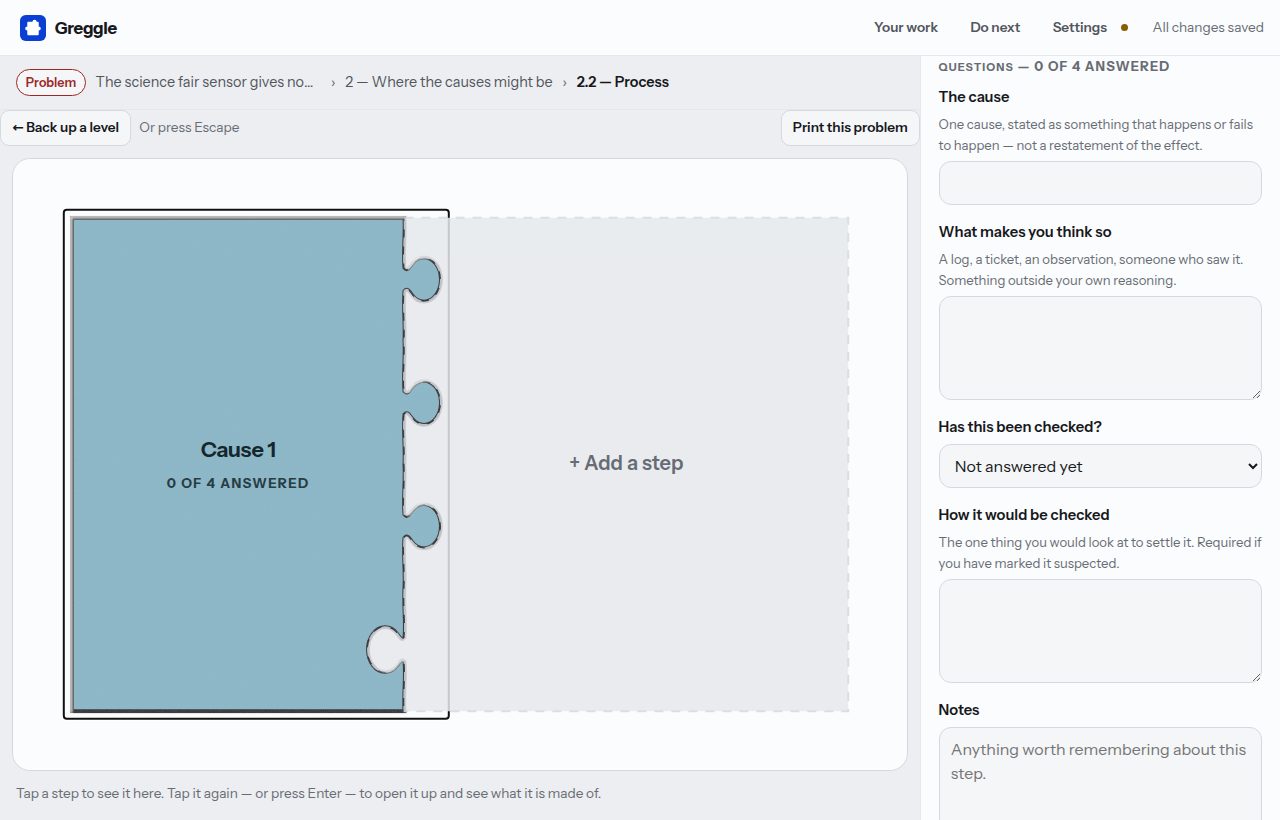
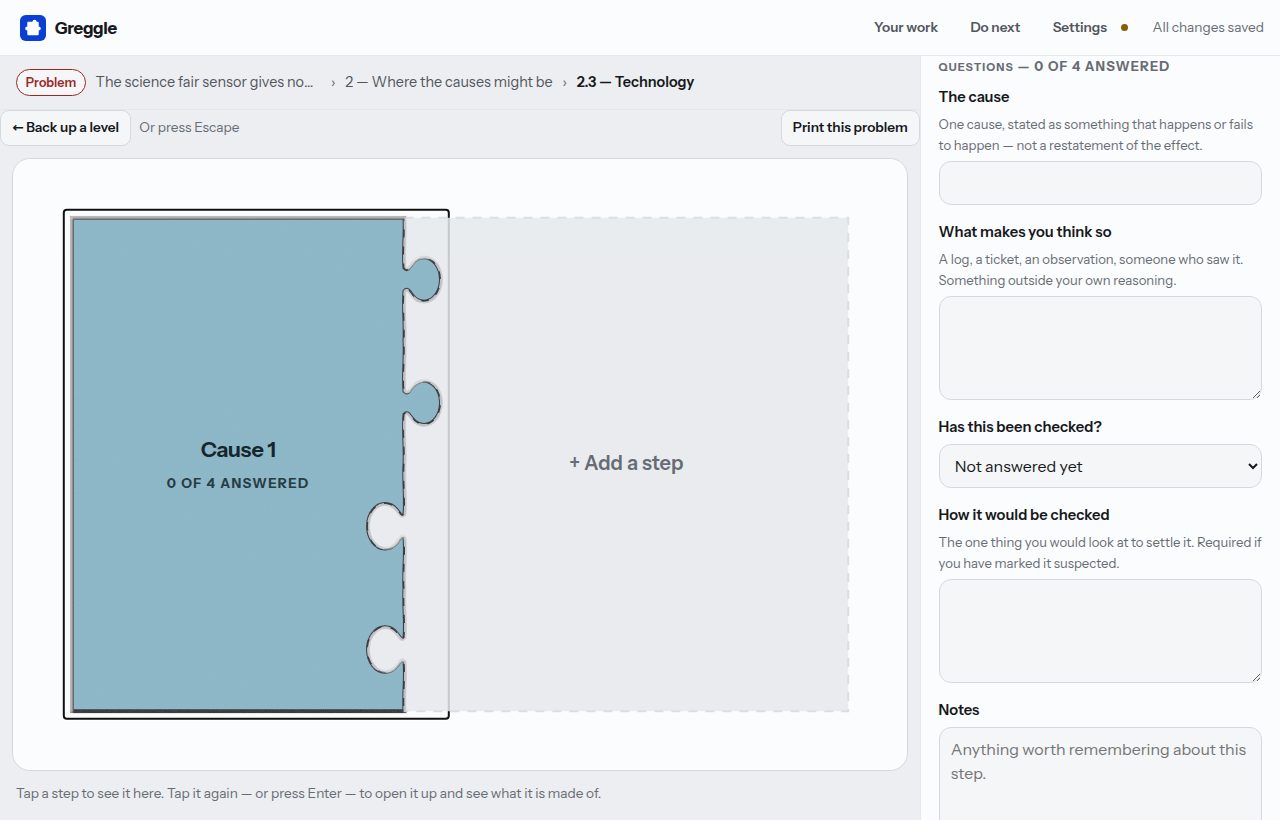
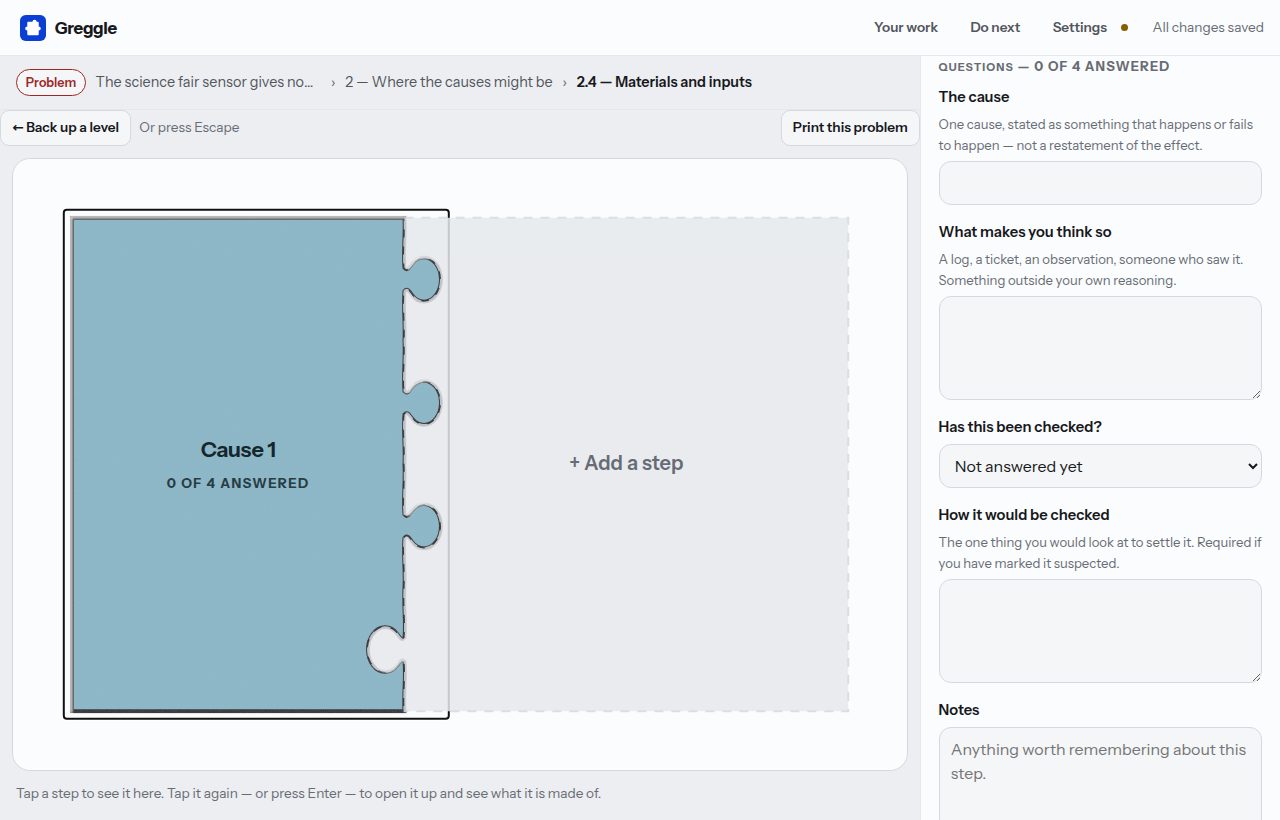
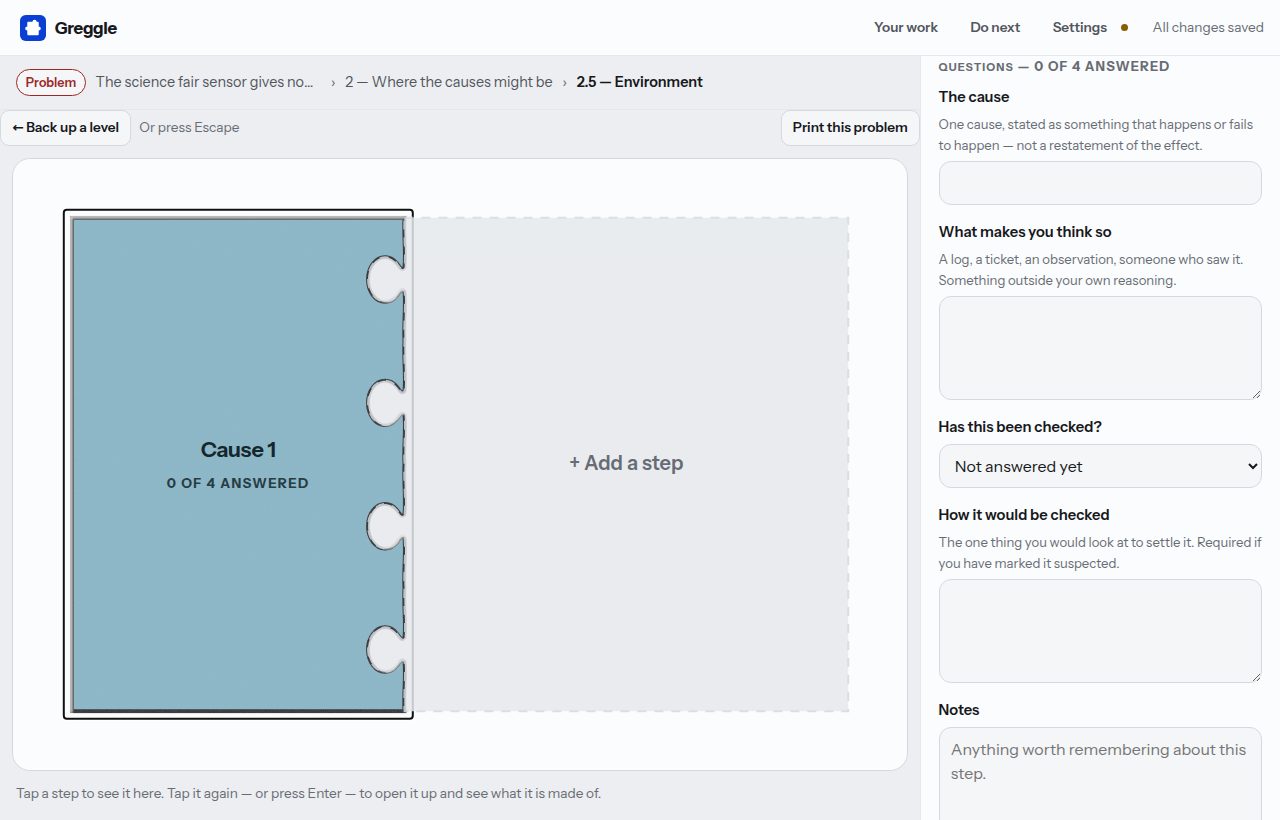
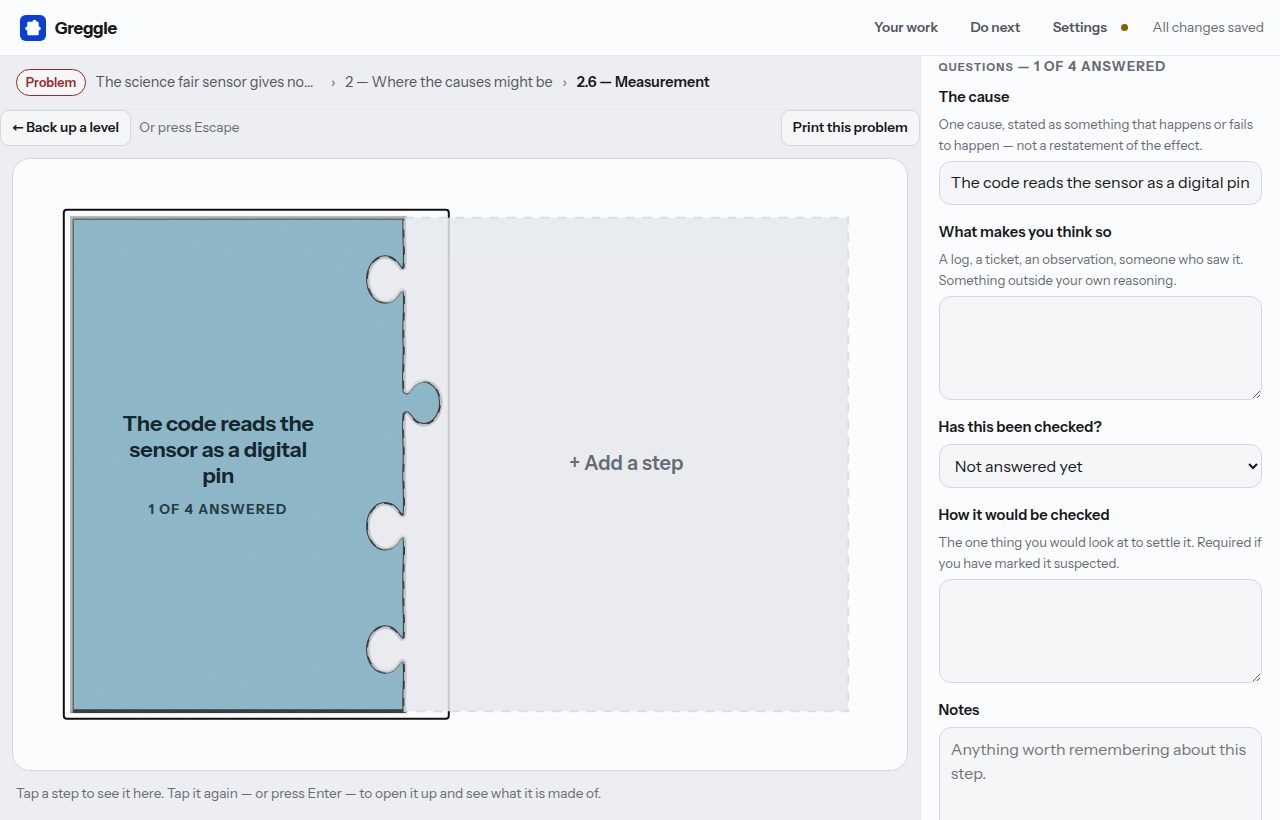
Nothing is added until you have looked at it. Open any step and it becomes a board of its own. Steps that cannot sensibly be cut smaller get marked as actions, and every action collects in one flat list.
What the check looks for
One button reads the whole branch back. On this method it reports, among other things:
- Causes have been written and not one says what makes you think so.
- A cause is marked suspected with no way to check it, so it will stay suspected and quietly harden into a fact.
- All the causes sit in one category, which usually means thinking stopped where the suspicion started.
- A cause just says the effect again in different words.
A worked example
Left to itself, the investigation would have started with the sensor being broken and stayed there. Working the ribs in order is what reached the measurement rib, and the measurement rib is where the answer was.
Where it falls down
The default categories don’t suit every problem, and people either force causes into headings that don’t fit or skip the headings that feel irrelevant. Adapt the names, keep the number, and force one weak cause into every rib. The weak cause in the rib you nearly skipped is, surprisingly often, the answer.
It also invites a board of confident guesses, all marked as if they were known. The verified, suspected or ruled out marking is the protection, and it only works if suspected is used honestly and carries a check beside it.
Pairs well with
- 5 Whys. The partner method. Go wide here first, then take the most likely cause into five whys.
- Issue Tree. A fishbone is an issue tree with the first split chosen for you. When the categories don’t fit, build the tree instead.
- Pre-mortem. For a Risk that hasn’t happened yet, the pre-mortem asks the same question in the past tense.
Further reading
- Kaoru Ishikawa, Guide to Quality Control, 1968; English edition from the Asian Productivity Organization, 1976. The diagram is in the first chapters.
- Kaoru Ishikawa, What Is Total Quality Control? The Japanese Way, 1985, for the thinking behind it.
Look under every heading. Then bet on one.
This opens the app with the kind already chosen. Give the thing a name, press Start, and Cause and Effect is proposed on the new board for you to look over before anything is added. Free, no account, works offline.
Open Greggle with Cause and Effect